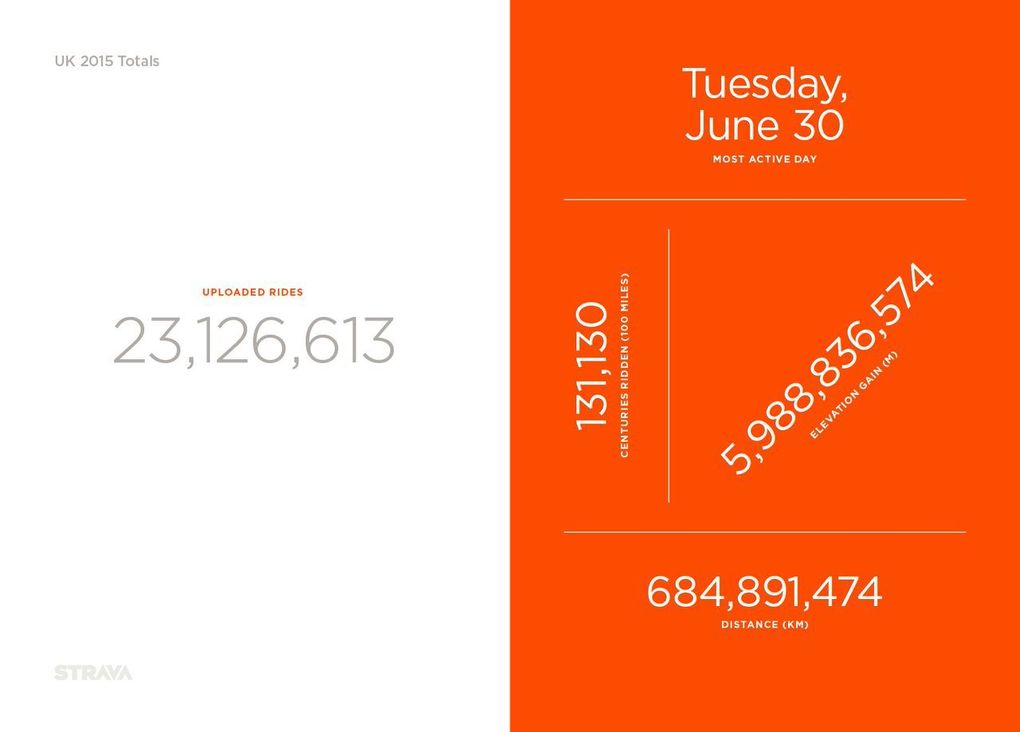
There’s no denying it – Strava has changed the way a lot of people ride – for better or for worse. In fact, in recently revealed stats the ride and run logging site told us that they received a jaw dropping 5.3 activities every second during 2015.
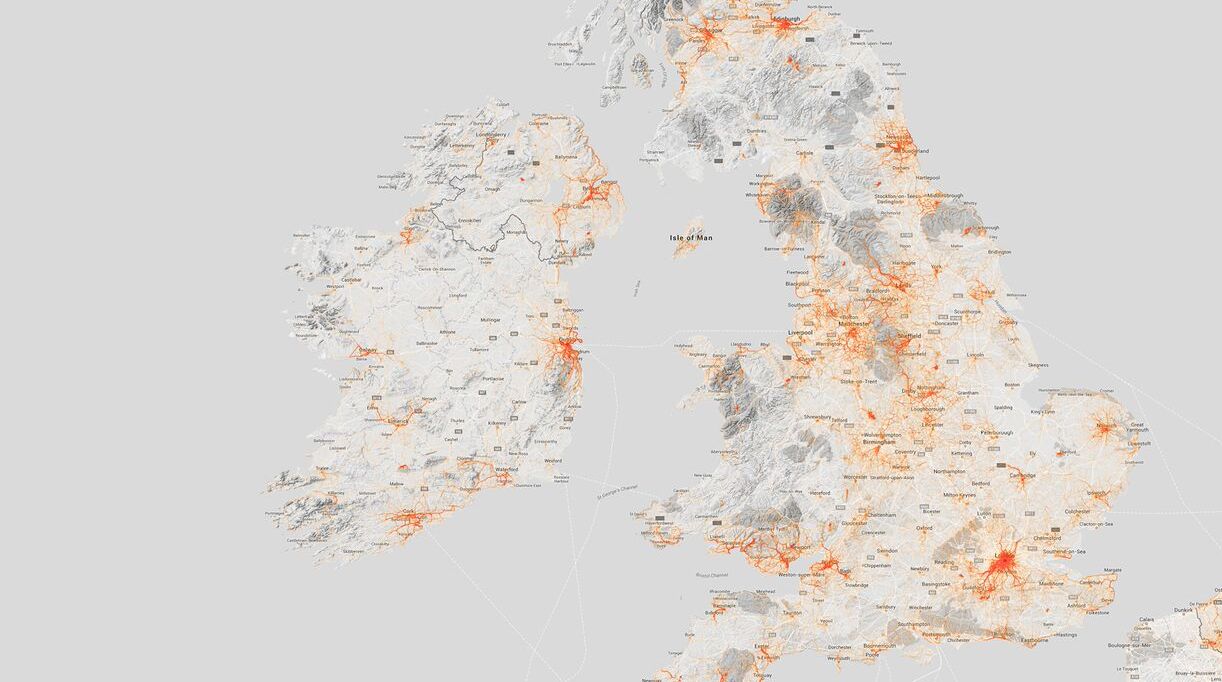
That amounted to 115,788,572 rides in total – 23,126,613 of which were in the UK. Alongside useful nuggets – such as the fact that the most activity heavy day of the year in the UK was 30 June – Strava have also unveiled the average ride and annual mileage of our UK riders.
Strava Data Shows Huge Rise in UK Female Cyclists
We can’t help but admit we were just a bit intrigued to find out how we stacked up compared to the average UK female, and indeed the average UK male – we expect most of you will be equally curious, too.
Joanna-Bloggs’ average ride is 34km (that’s 21 miles) – only a smidge less than the total reached by Jo Bloggs at 41 km (25 miles). Our average speed is a little slower at 19.8km/h (12.3mph) but actually total time riding suggests we women are equally dedicated – spending a few minutes longer in the saddle.
Climbing varies a lot per region – the hilliest rides took place in Merthyr Tydfil (in South Wales) whilst Cambridgeshire hosted the flattest rides – but as a UK overall average women’s outings covered 226 metres (741 feet).

Though averages per ride didn’t differ that greatly between men and women, overall yearly averages did – with women totalling 410 km (254 miles) to men’s 832 km (513 miles). However, those of us geeky enough to divide metres climbed by kilometres travelled would be pleased to note a very thin difference between men and women’s climbing ratios.


