Cycling and running social media site Strava has released its ‘end of year’ stats for 2016, with a handy break down of average ride length, speed and elevation.
Comparing 2016 data with that of 2015, we see an increase in total rides. In 2015, around 23 million rides were uploaded, compared to 27 million in 2016.
Average ride distance remains the same at 34km for women, usually with around 287m elevation gain and at 19.8km per hour. The average male ride is around 41km, with 375m elevation gain at about 25.6km per hour.

Whilst total number of rides rose from 2015 to 2016, and average rides remained of a similar distance, annual totals per rider seemed to drop. It looks like there are more users, doing fewer rides.
The average woman, over the course of the year, totted up 324km and 16.5 hours riding, vs 410km and 25 hours in 2015.

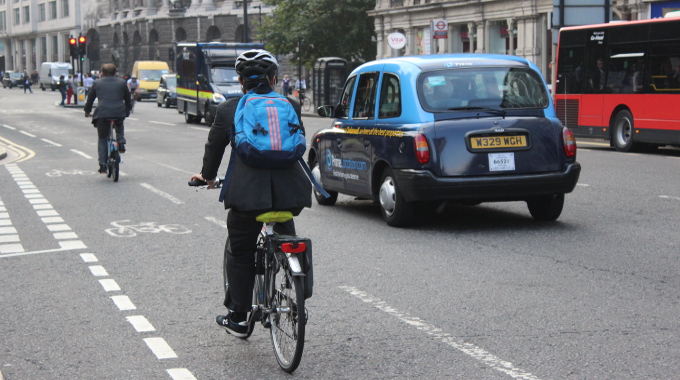
Total number of commutes has also increased, from 171k in 2015 to 223k in 2016. However, average distance has decreased from 15.9km to 13.5km.
In terms of competition across the country, London topped the charts for total activities, with 4.4 million, compared to 915k in West Yorkshire and 898k in Manchester.
The fastest average ride took place in Ards, whilst the hilliest was in Merthyr Tydfil, the flattest was in York. The longest average rides went to the people of Banbridge whilst Glaswegians completed the shortest average rides.
Strava also shared the most competitive segments, with those in London’s Richmond Park and around Surrey’s Box Hill taking the top spots.

How do your rides stack up against the average?
You might also like…


